View virtual device logs
Viewing logs via Goliothctl
After sending a log entry to Golioth you can search logs using goliothctl logs. Here is an example showing logs from the last 10 minutes:
$ goliothctl logs --interval 10m
[2022-05-04T18:52:36Z] level:DEBUG  module:"golioth_hello"  message:"Start Hello sample"  device_id:"623a1a9d3023c546c6b19c99" metadata:"{"func":"main","index":1,"uptime":68349792}"
[2022-05-04T18:52:36Z] level:INFO  module:"golioth_hello"  message:"Sending hello! 0"  device_id:"623a1a9d3023c546c6b19c99" metadata:"{"index":2,"uptime":68349822}"
[2022-05-04T18:52:36Z] level:WARN  module:"golioth_hello"  message:"Failed to send hello!"  device_id:"623a1a9d3023c546c6b19c99" metadata:"{"index":3,"uptime":68350341}"
[2022-05-04T18:52:36Z] level:INFO  module:"golioth_system"  message:"Starting connect"  device_id:"623a1a9d3023c546c6b19c99" metadata:"{"index":4,"uptime":68350433}"
[2022-05-04T18:52:36Z] level:INFO  module:"golioth_system"  message:"Client connected!"  device_id:"623a1a9d3023c546c6b19c99" metadata:"{"index":5,"uptime":68682373}"
[2022-05-04T18:52:39Z] level:INFO  module:"golioth_hello"  message:"Sending hello! 1"  device_id:"623a1a9d3023c546c6b19c99" metadata:"{"index":6,"uptime":73350402}"
[2022-05-04T18:52:44Z] level:INFO  module:"golioth_hello"  message:"Sending hello! 2"  device_id:"623a1a9d3023c546c6b19c99" metadata:"{"index":7,"uptime":78351745}"
[2022-05-04T18:52:49Z] level:INFO  module:"golioth_hello"  message:"Sending hello! 3"  device_id:"623a1a9d3023c546c6b19c99" metadata:"{"index":8,"uptime":83361450}"
[2022-05-04T18:52:54Z] level:INFO  module:"golioth_hello"  message:"Sending hello! 4"  device_id:"623a1a9d3023c546c6b19c99" metadata:"{"index":9,"uptime":88370971}"
[2022-05-04T18:52:59Z] level:INFO  module:"golioth_hello"  message:"Sending hello! 5"  device_id:"623a1a9d3023c546c6b19c99" metadata:"{"index":10,"uptime":93380676}"
[2022-05-04T18:53:04Z] level:INFO  module:"golioth_hello"  message:"Sending hello! 6"  device_id:"623a1a9d3023c546c6b19c99" metadata:"{"index":11,"uptime":98390411}"
[2022-05-04T18:53:09Z] level:INFO  module:"golioth_hello"  message:"Sending hello! 7"  device_id:"623a1a9d3023c546c6b19c99" metadata:"{"index":12,"uptime":103391693}"
You can also filter the logs by Zephyr module. This could be a Golioth module, a Zephyr subsystem or your application. You can see the module names are being reported in the output above. This example filters for the messages sent by the golioth_system module:
$ goliothctl logs --interval 1h --module golioth_system
[2022-05-04T18:52:36Z] level:INFO  module:"golioth_system"  message:"Starting connect"  device_id:"623a1a9d3023c546c6b19c99" metadata:"{"index":4,"uptime":68350433}"
[2022-05-04T18:52:36Z] level:INFO  module:"golioth_system"  message:"Client connected!"  device_id:"623a1a9d3023c546c6b19c99" metadata:"{"index":5,"uptime":68682373}"
You can check for more commands to search logs on the goliothctl logs reference docs.
Viewing logs via the Golioth Console Interface
You can use Golioth Console to check the logs.
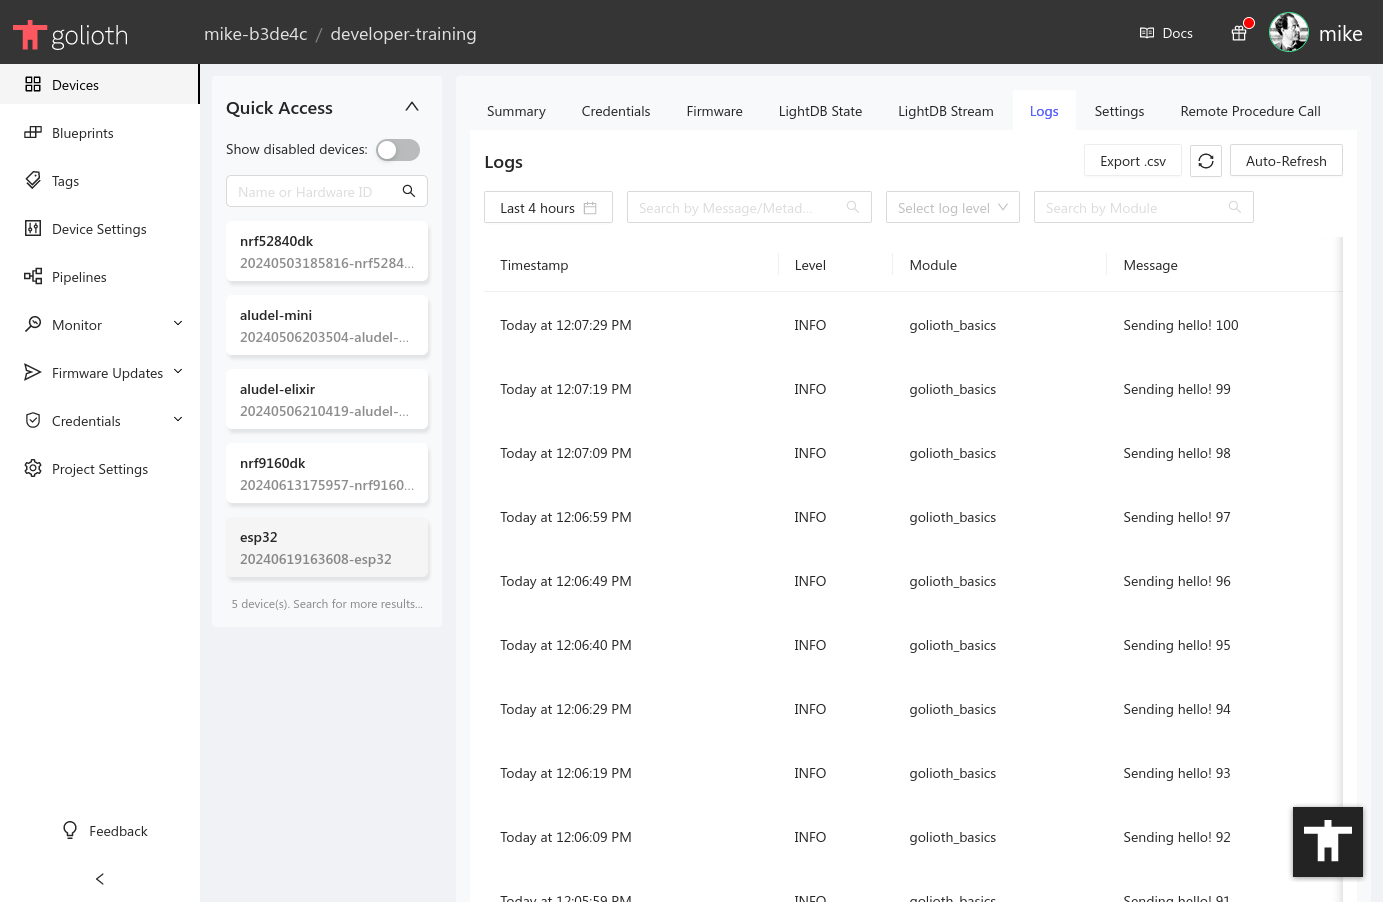
Filtering is selectable via the menu items, including date ranges, devices, log levels, modules and more.